Summary
In large organizations, Procure-to-Pay (P2P) process discipline is critical for:
- Budget control
- Spend forecasting accuracy
- Cash flow optimization
- Audit and compliance
However, in practice, operational teams often prioritize speed over process — creating Purchase Requisitions (PR) and Purchase Orders (PO) after invoices are received. This seemingly small behavior creates:
- Longer invoice processing cycles
- Lost early-payment discounts (e.g., Net 10 / Net 15)
- Weaker budget visibility and accrual accuracy
- Increased compliance and audit risk
This project started as a Marketing process investigation, and later expanded into a cross-department analytics framework covering: Marketing, Engineering, IT, Facilities, HR, Tech Services and other functions.
Using SAP ERP and invoice processing data, I built a Power BI analytics platform to:
- Quantify process violations
- Identify root causes by vendor, department, and requisitioner
- Track behavior trends over time
- Support management decisions and corrective actions
- Extend from process compliance into strategic spend analysis
Background
In a well-controlled procurement environment: PR and PO should be created before goods or services are received.
This ensures:
- Proper approval workflow
- Budget reservation
- Contract and pricing validation
- Predictable cash flow and accruals
But in fast-moving business functions (Marketing, Engineering, IT, Facilities), teams often engage vendors first, then “fix the paperwork later”. This leads to:
- Invoice exceptions
- Manual AP intervention
- Delayed payment
- Lost discounts
- Reactive rather than proactive spend management
Phase 1 — Marketing Pilot: Defining the Problem
The project started in Marketing, where we observed frequent cases of: Invoice received → PR created → PO created → Payment, instead of: PR → PO → Invoice → Payment.
Key Questions
- How big is the problem (volume & dollars)?
- Who is driving it (vendors / requisitioners)?
- Is it random or systematic?
- What is the business impact?
Data Sources & Modeling
Systems
- SAP ERP:PR info, PO info, Vendor info, Cost Center info
- Invoice Processing System: Invoice date, posting date, payment status, amount
Data Engineering
- Joined PR, PO, and invoice documents
- Created derived metrics:
- PR Created Before / After Invoice
- Time Lag (Invoice Date – PR Date)
Cleaned:
- Vendor master data
- Duplicate records
- Date inconsistencies
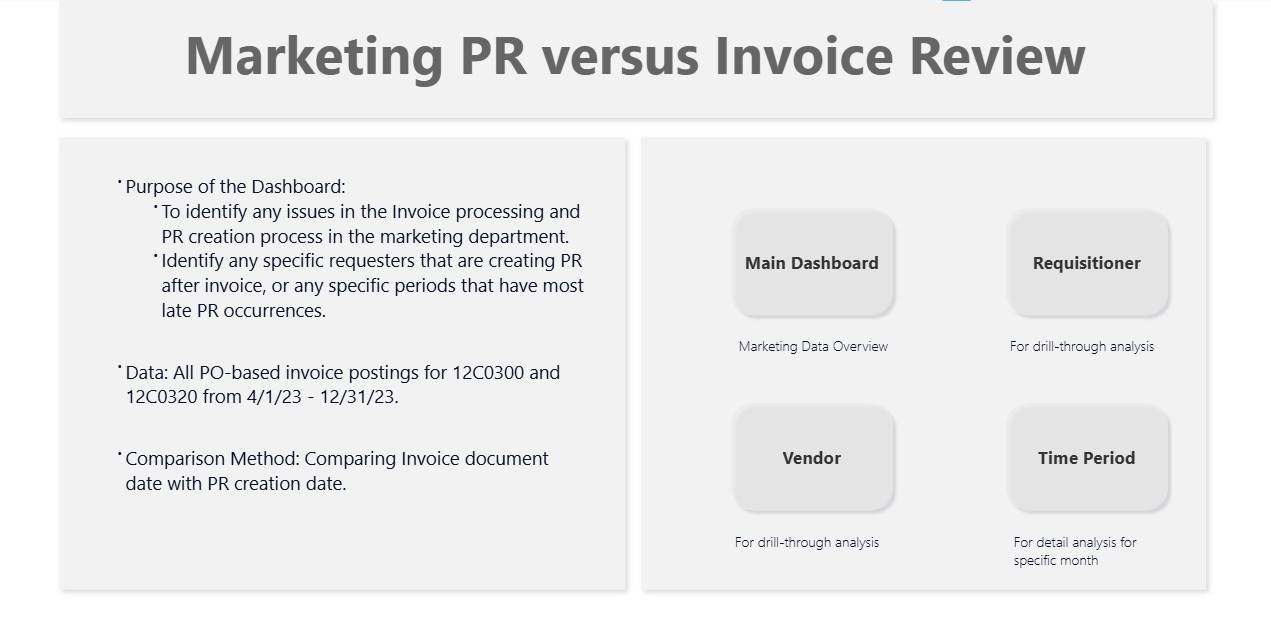
Phase 1 Dashboard — Marketing PR vs Invoice Timing
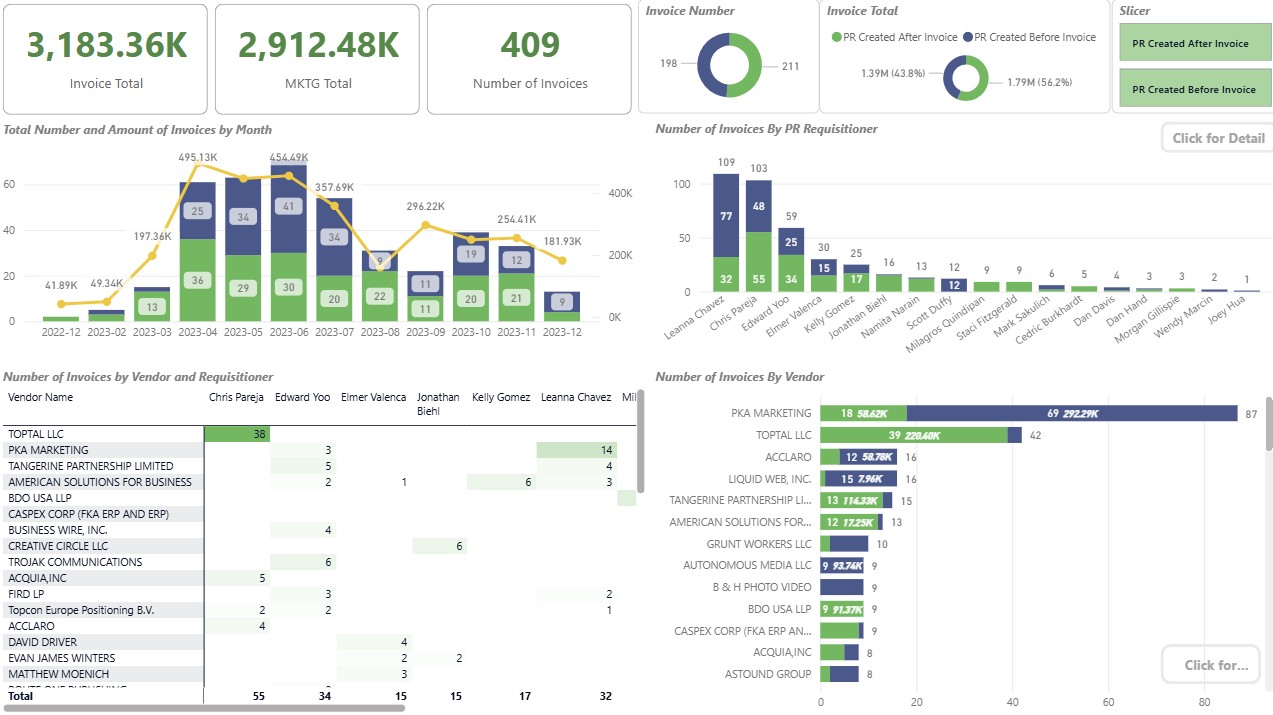
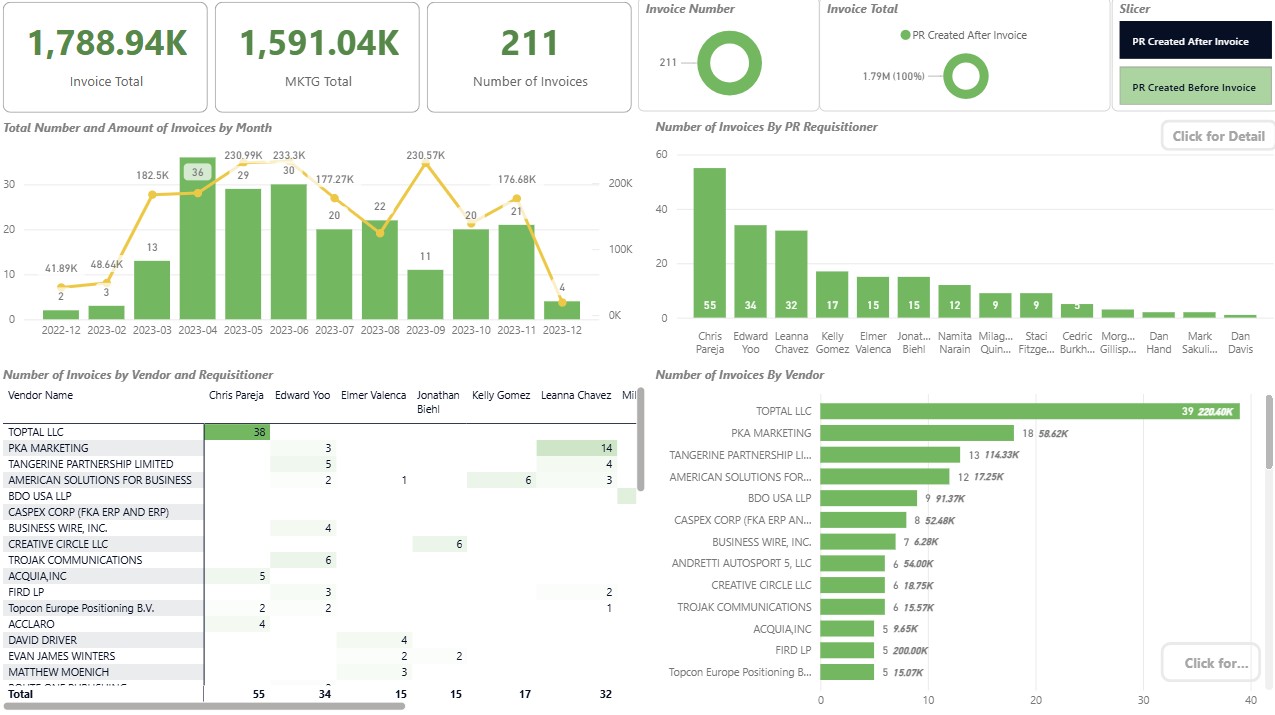
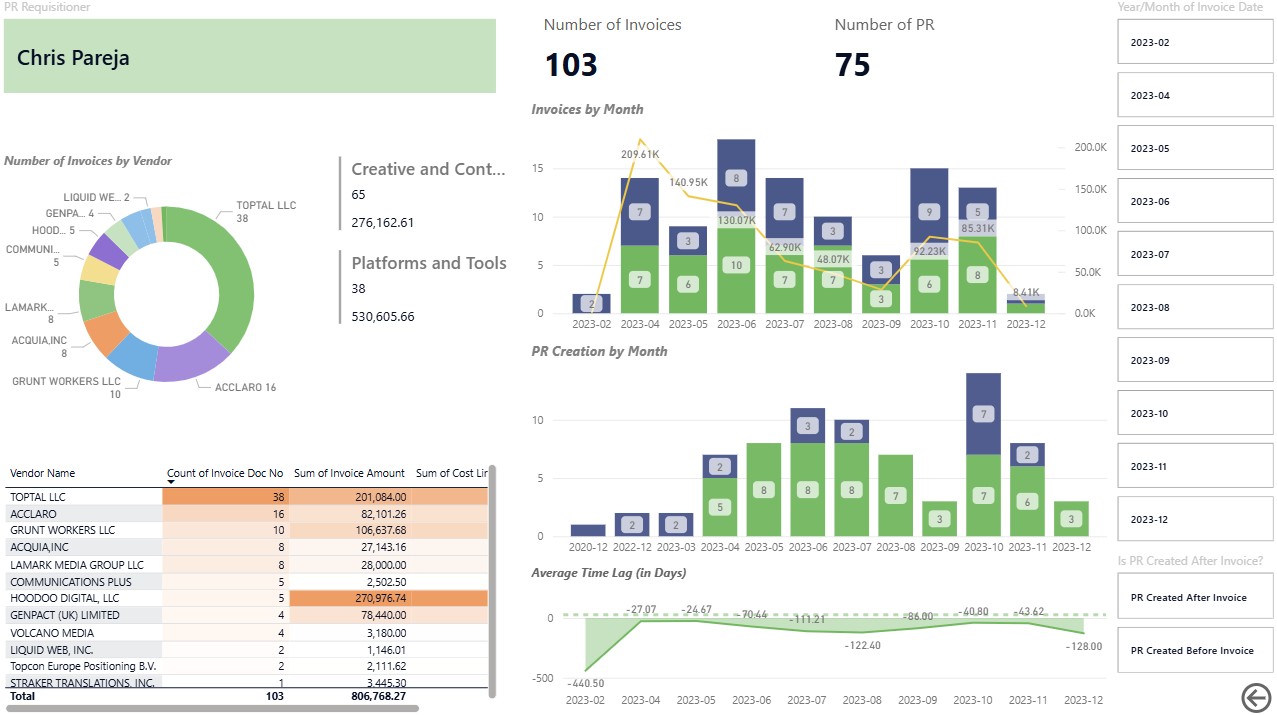
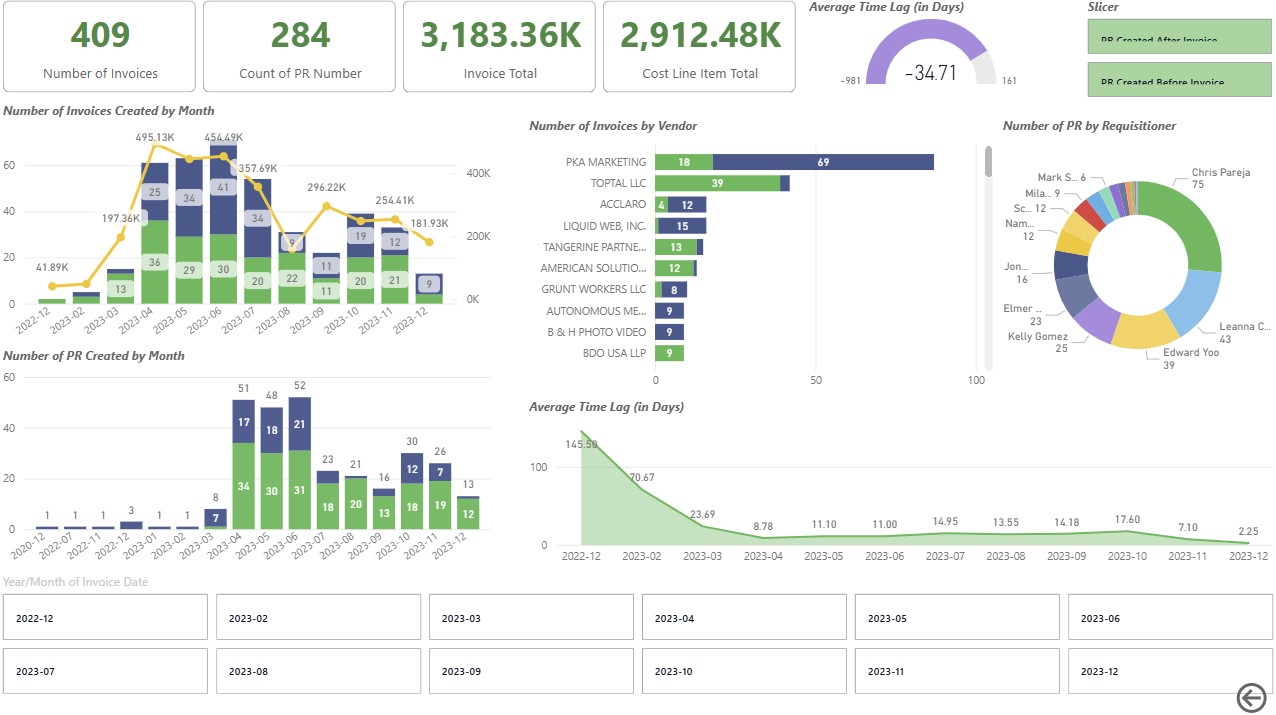
What it Shows
- Total invoices and total spend impacted
- Monthly trend of violations
- Top vendors involved
- Top requisitioners driving the issue
- Distribution by invoice size
- Average time lag
Insights
- The issue was systematic, not occasional
- A small group of vendors and users drove most violations
- The company was:
- Losing early payment discounts
- Increasing AP workload
- Reducing forecast reliability
This dashboard became the management discussion anchor.
Phase 2 — Scaling to All Departments
After success in Marketing, the framework was extended company-wide to include: Engineering, IT, Facilities, HR, Tech Services, Sales & other functions
Cross-Department Dashboard
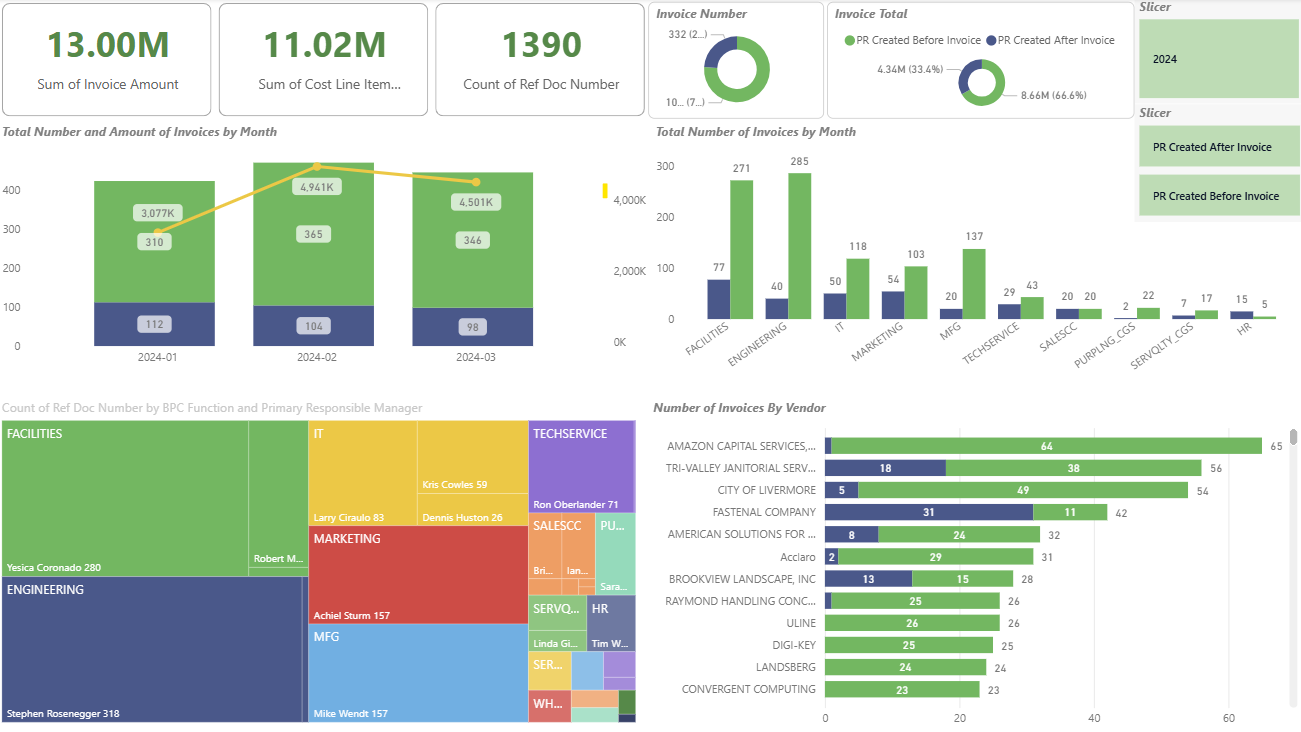
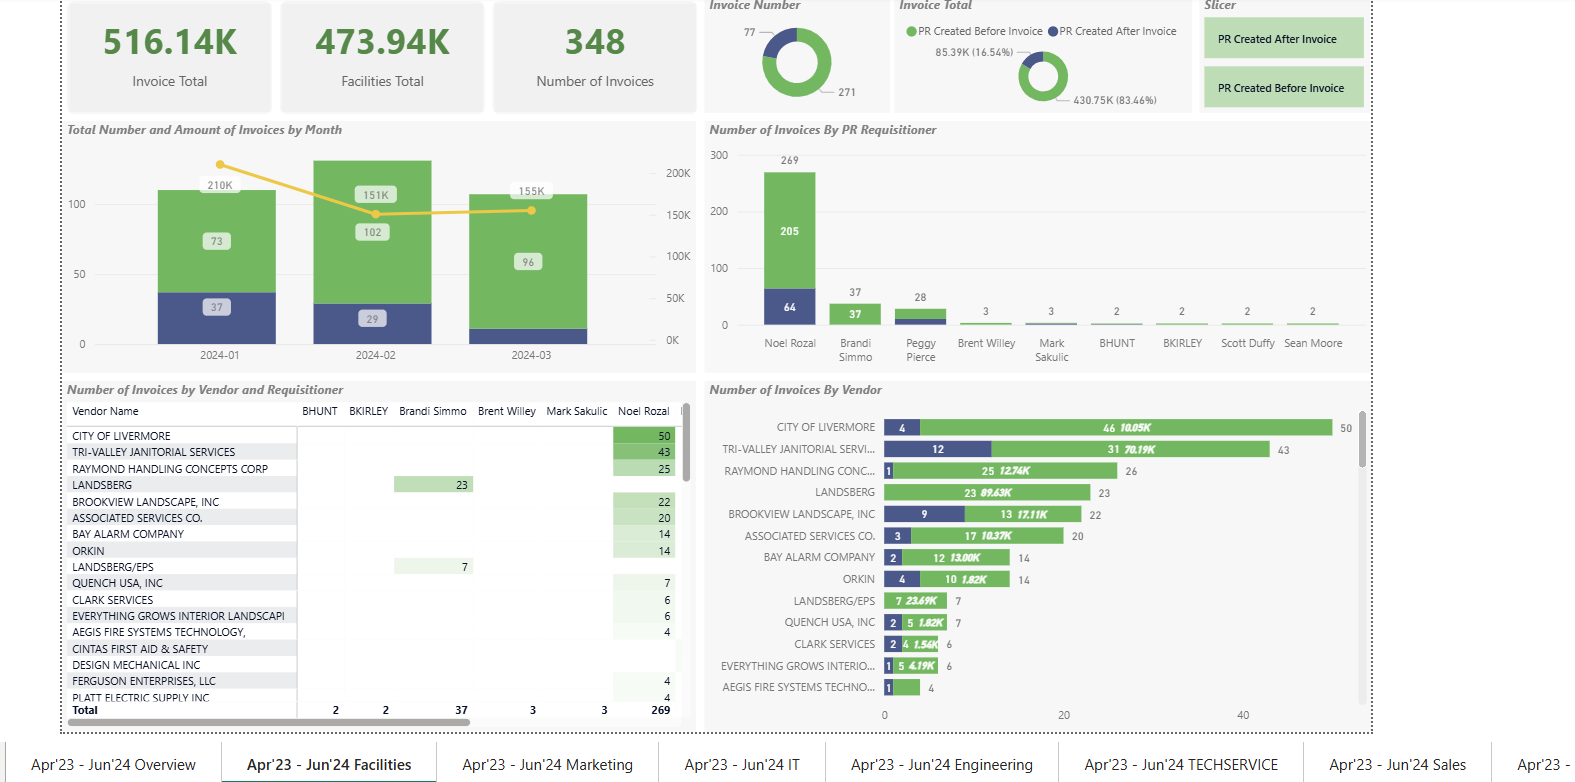
This version adds:
- Department-level comparisons
- Treemap of process violations by function and manager
- Vendor concentration across departments
- Monthly trends by department
What It Enables
- Identify which functions have structural process gaps
- Distinguish:
- Training issues
- Workload issues
- Process design issues
- Move from:
- “Finance is complaining about process” to:
- “Here is the quantified, ranked, visualized business impact.”
Phase 3 — Deep Dive: Engineering Department
Engineering has:
- High spend volume
- Complex vendor ecosystem
- Both PO and Non-PO spend patterns
So we built two dedicated analytical views.
3A — Engineering PR vs Invoice Compliance Dashboard
This mirrors the Marketing analysis, but focuses on:Much larger scale; More vendors; More requisitioners; Larger financial exposure.
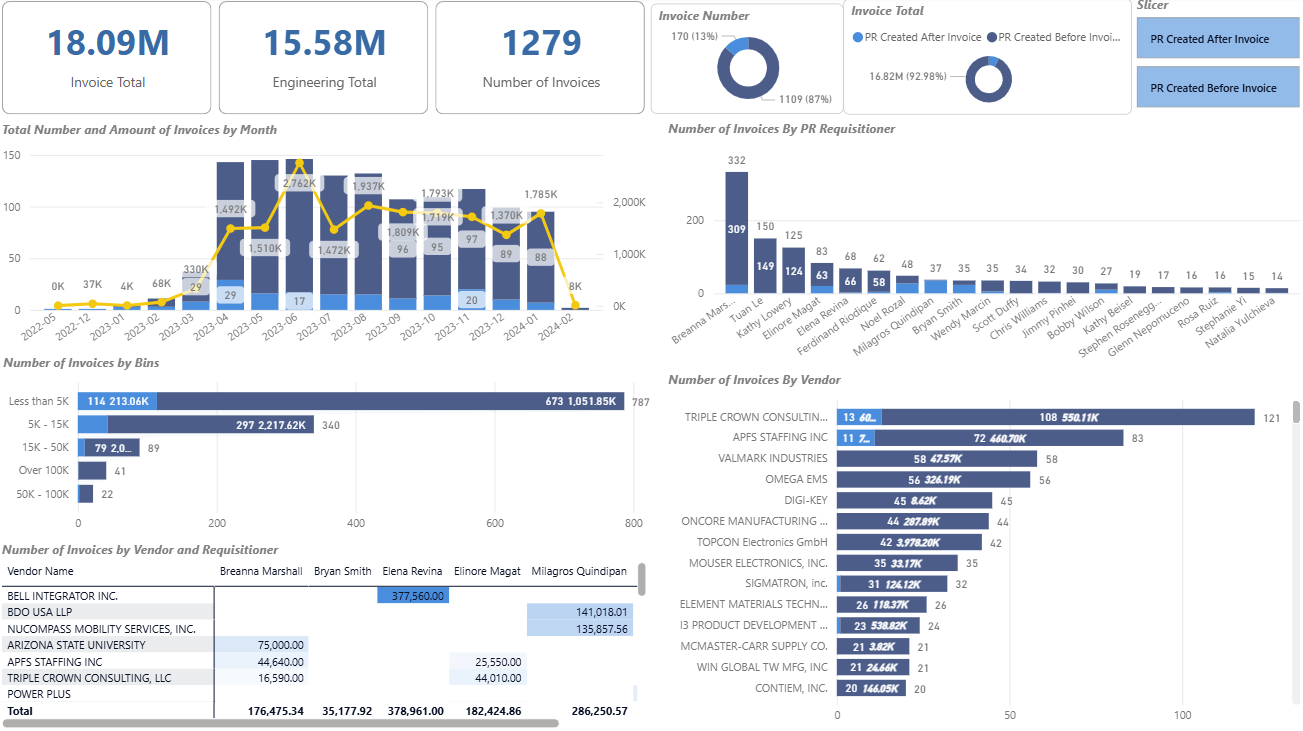
It answers:
- How compliant is Engineering vs other functions?
- Which teams or managers are driving violations?
- Which vendors are repeatedly bypassing procurement discipline?
3B — Engineering Non-PO (Finance Invoice) Spend Analysis
This is a different but strategically critical extension of the project.
Here the goal is not process timing, but: Understanding what changed in spend structure, YoY and YTD.
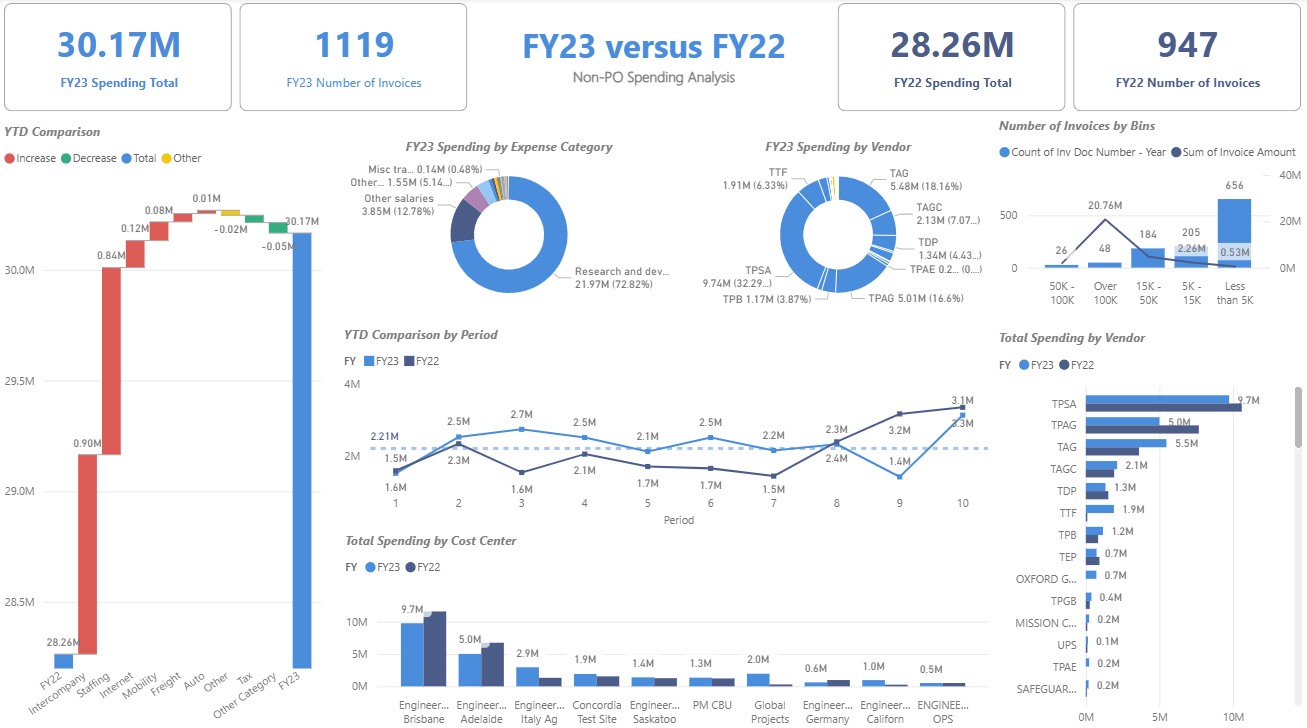
This dashboard shows:
- FY23 vs FY22 spending comparison
- YTD change bridge (increase/decrease by category)
- Spend mix by: Expense category & Vendor & Cost Center
- Invoice size distribution changes
- Trend by period
Questions It Answers
- Where did Engineering spend increase or decrease?
- Which categories are driving the change?
- Are we:
- Consolidating vendors?
- Fragmenting spend?
- Shifting cost structure?
- Is spend growth aligned with strategy?
This turns the platform from a compliance tool into a strategic spend intelligence system.
Business Impact
This analytics framework is now used to:
- Support BU leadership discussions
- Drive:
- Process discipline
- Budget ownership
- Spend transparency
- Enable:
- Targeted corrective actions
- Vendor strategy review
- Policy and workflow redesign
Concrete benefits:
- Reduced invoice cycle time
- Better early-payment discount capture
- Improved forecast accuracy
- Stronger audit posture
- Higher-quality business partnering conversations