Background
In large, multi-process organizations, SOX and internal control testing is not just a compliance exercise — it is a project management, resource allocation, and risk prioritization problem.
Typical challenges include:
- Limited visibility into control population structure (key vs non-key, risk levels, manual vs automated)
- Difficulty tracking testing progress across rounds (Round 1, Round 2, Year-End)
- Uneven workload distribution across testers
- Lack of management insight into coverage, bottlenecks, and execution quality
To address these issues, I designed and built a SOX Control Testing Management Dashboard to give both project-level and executive-level visibility into:
- What controls we have
- Who owns and tests them
- How and when they are tested
- How effectively the testing program is progressing
Objectives
The dashboard was designed to answer four core management questions:
- Control Landscape: What does our control population look like by risk, key/non-key, process, and method?
- Execution Progress: Are we on track across Round 1, Round 2, and Year-End testing?
- Resource Management: Who is testing what, and is workload balanced?
- Coverage & Quality: Are we achieving sufficient coverage across processes and risk areas?
Dashboard 1 — Control Population & Structure Overview
This dashboard focuses on what we are managing.
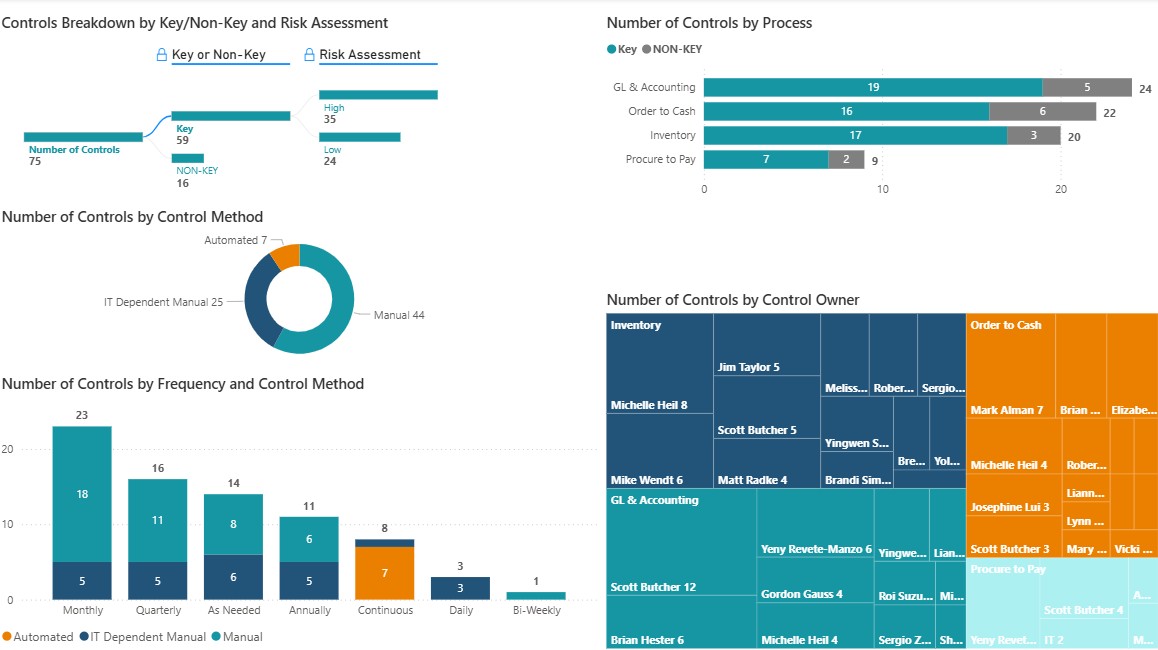
It provides a full breakdown of:
1. Control Inventory Structure
- Key vs Non-Key controls
- High-risk vs Low-risk controls
- Distribution by business process:
- GL & Accounting
- Order to Cash
- Inventory
- Procure to Pay
This allows management to quickly see:
- Where risk is concentrated
- Which processes carry the highest control density
- Whether the control environment is overly manual or properly automated
2. Control Design Characteristics
The dashboard also analyzes:Control method & Control frequency.
This helps answer questions such as:
- How much are we relying on manual controls?
- Are high-frequency controls overly concentrated in certain areas?
- Where does automation have the highest ROI?
3. Ownership & Accountability
Using a treemap view, the dashboard shows:
- Control ownership by person and by process
- Concentration risk (e.g., too many controls owned by a single individual)
- Organizational dependency patterns
This is extremely useful for: Succession planning; Workload balancing; Identifying key-person risk.
Dashboard 2 — Testing Execution & Performance Management
This dashboard focuses on how well we are executing the testing program.
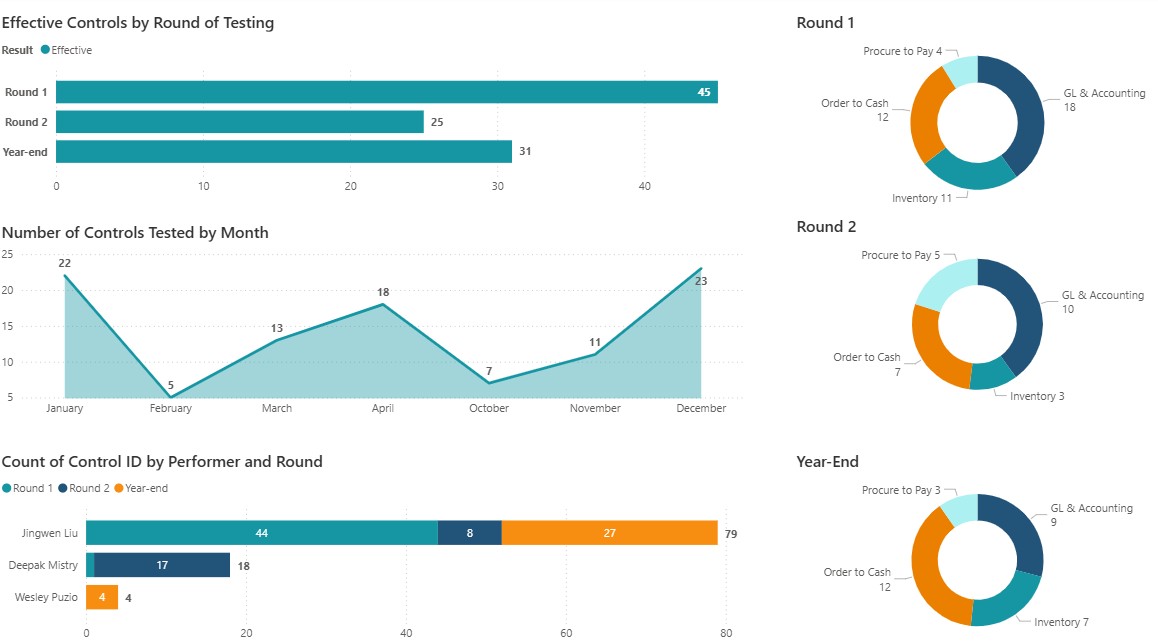
1. Testing Progress by Round
The dashboard tracks: Round 1 testing, Round 2 testing, Year-End testing
It shows:
- Number of controls tested
- Number of effective results
- Coverage by process for each round
This allows management to:
- Instantly see whether testing is on track
- Identify lagging processes
- Reallocate resources before deadlines are at risk
2. Monthly Execution Monitoring
A monthly trend view shows:
- How many controls are tested each month
- Peaks, valleys, and workload seasonality
- Bottlenecks and compression risk near deadlines
This supports:
- Better project planning
- Smoother resource allocation
- Reduced year-end crunch risk
3. Tester Productivity & Workload Distribution
The dashboard also analyzes:
- Number of controls tested per tester
- Breakdown by round (Round 1 / Round 2 / Year-End)
- Total workload distribution
This enables:
- Fair workload balancing
- Identification of capacity constraints
- Data-driven staffing and scheduling decisions
Business Impact
Key benefits:
✅ Full transparency into control population and testing status
✅ Better planning and sequencing of testing activities
✅ Improved workload balancing across the team
✅ Earlier detection of schedule and coverage risks
✅ Stronger management confidence in SOX execution quality