The original dataset can be found on Kaggle.
Business Understanding
The business problem we wanted to address was how to be able to quickly, efficiently, and consistently price new diamonds coming into the stock of diamond retailer. We also wanted to determine which characteristics of diamonds contribute the most to the price.
More specifically, we assumed that we were a group of data analysts in a luxury brand jewelry company who want to build a model for predicting the price of diamonds. Our task was to utilize the information and data on hand to come up with a formula that uses the attributes of diamonds to easily and accurately calculate the value of each diamond. In order to stay competitive in the market, goods must be reasonably priced to compete with competitors, but must also maximize firm profits. Our company can use the model to identify good quality diamonds and fully understand which variables contribute most to diamond price.
Data Understanding
The dataset contains 53,940 observations and 11 variables. The variables include carat, cut, color, clarity, depth, and price as well as an identifier variable.
We decided to first investigate the correlation between each variable through exploratory analysis and plotting. We would then generate several models to predict how certain variables can affect the price of diamonds. This data mining solution, consisting of 5 models, addressed the defined business problem by helping the company better understand how the characteristics of a diamond related to price.
Data Preparation
-
Null Values: While there were no variables with explicitly null values, there were several observations in which the variables of x, y, and z, the measurements of diamonds, were classified as zero. These zero values would negatively impact our analysis, and there were very few of these observations, so we dropped the observation if any of those variables equalled zero.
-
Outliers: After we generated histograms and plots to investigate individual variables, outliers coulbe be identified. We excluded observations when depth of diamond is less than 50 or greater than 75 or when table is less than 50 or greater than 90. We also excluded the observations where y is greater than 20 or z is greater than 30. These changes resulted in a total of 36 dropped observations and a final cleaned data set of 53,904 observations.
-
Train & test data: In order to prepare for the modeling, we randomly divided the data into 2 subsets: train and test. We split the data 60% - 40% to the train set and the test set respectively, in order to provide out-of-sample performance results for each of the models we developed.
Data Visualization
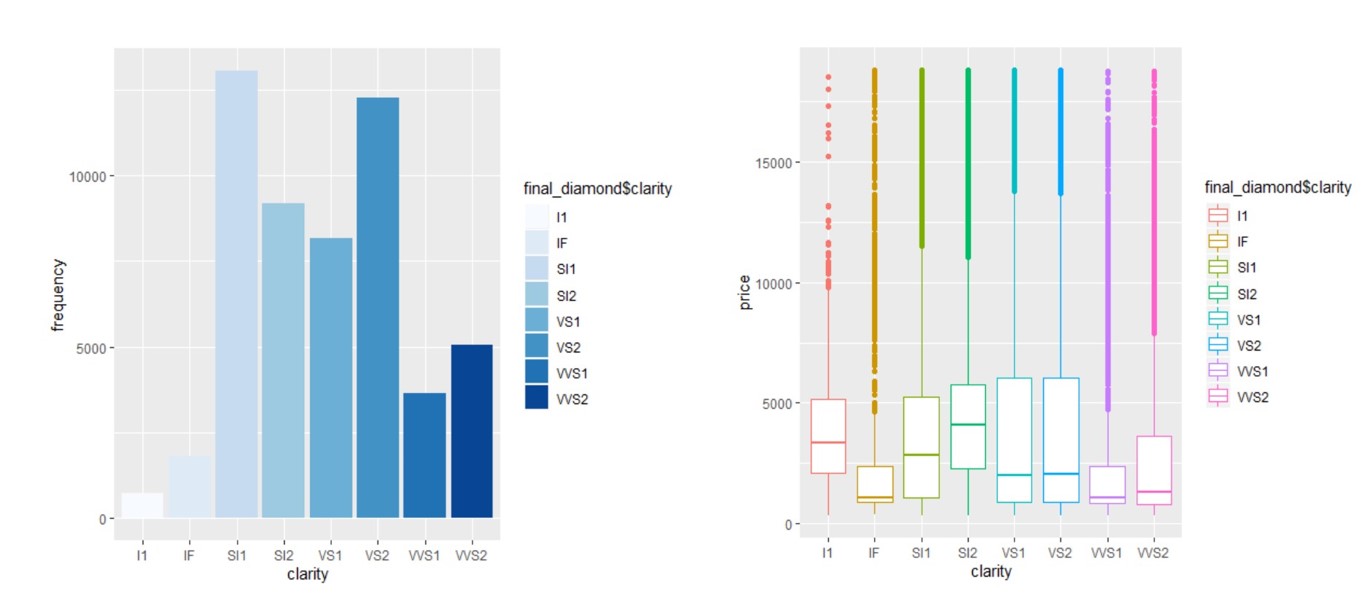
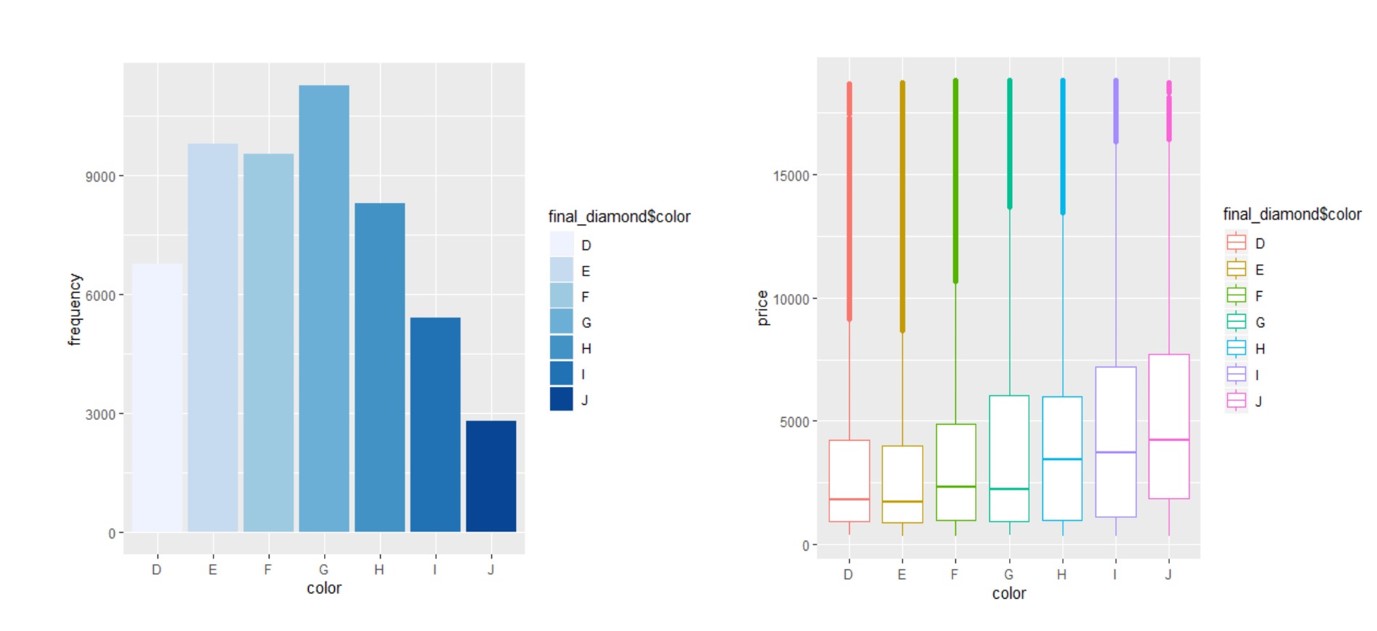
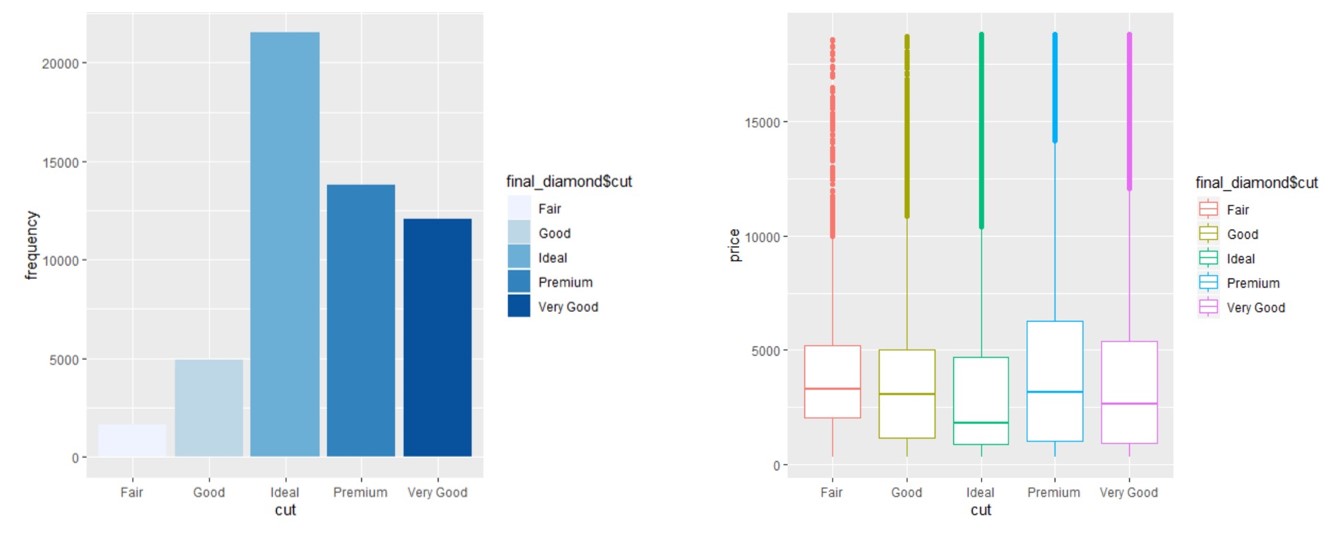
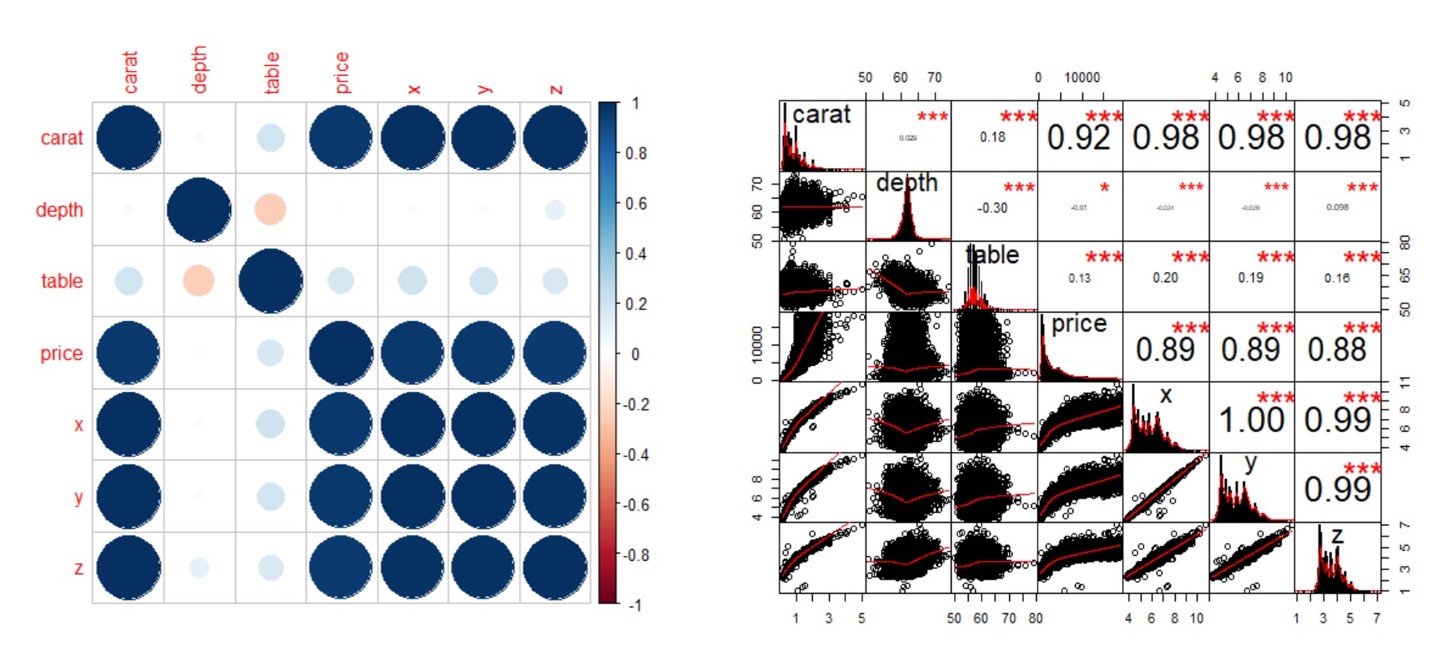
Modeling
PCA
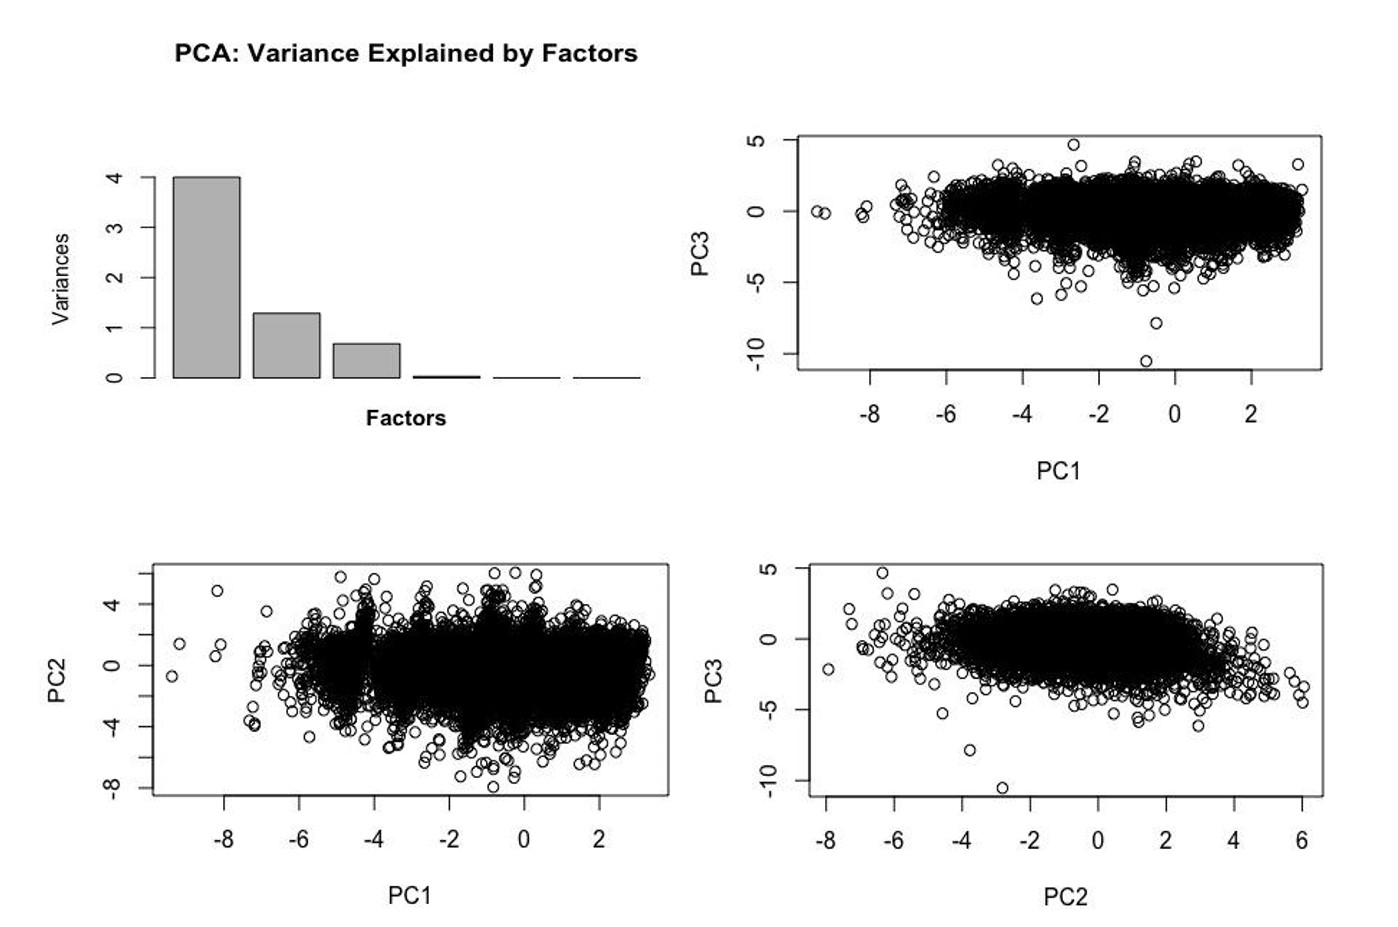
We used PCA to reduce the number of variables and intended to use the PCA factors in our regression model. Since Principle Component Analysis (PCA) only applies to the numeric variable, we first dropped the 3 categorical variables, cut, color and clarity, from the train dataset and then applied the PCA model. Based on the PCA: Variance Explained by Factors graph, we picked the first 3 factors, which explained most of the variation in the dataset. For each factor picked, we display the top features that are responsible for 3/4 of the squared norm of the loadings, includes x and y in PC1, depth in PC2 and table in PC3. The PCA model did not include the other two numeric variables, z and carat, in the first three factors.
Because each factor contained either a single quantitative variable or a combination of two quantitative variables, we found that it would be nearly as effective, and much simpler, to simply include the variables selected through the PCA factors (x, y, depth, table), add back the categorical variables we dropped previously, and run a linear model that included these variables.
Linear with Lasso
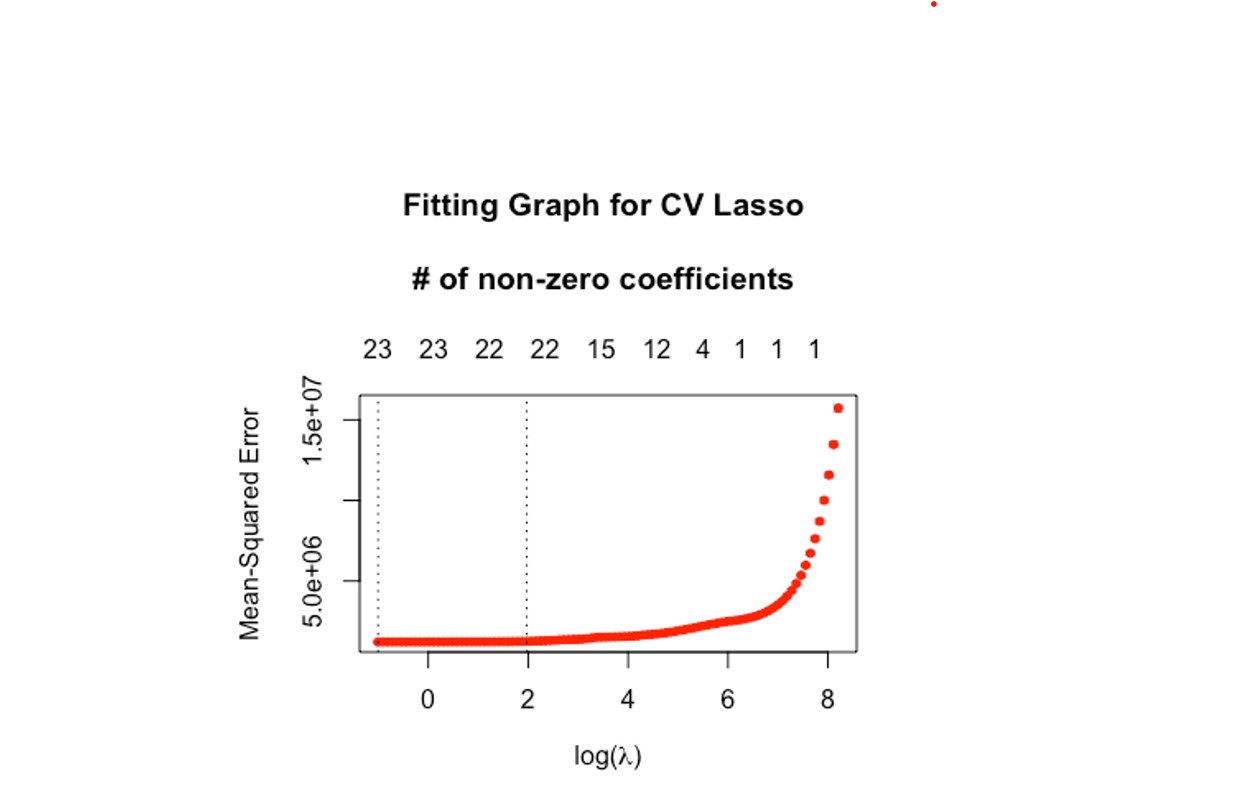
We ran Lasso and created 2 linear models based on the variables selected. As the below graph shows, the minimum lasso value gave us 23 variables and 1 standard error lasso value gave us 22 variables. We then created 2 linear model: the minimum model with 23 variables and the 1 standard error model with 22 variables. We picked the minimum model as it has lower AIC score.
Quantile Regression
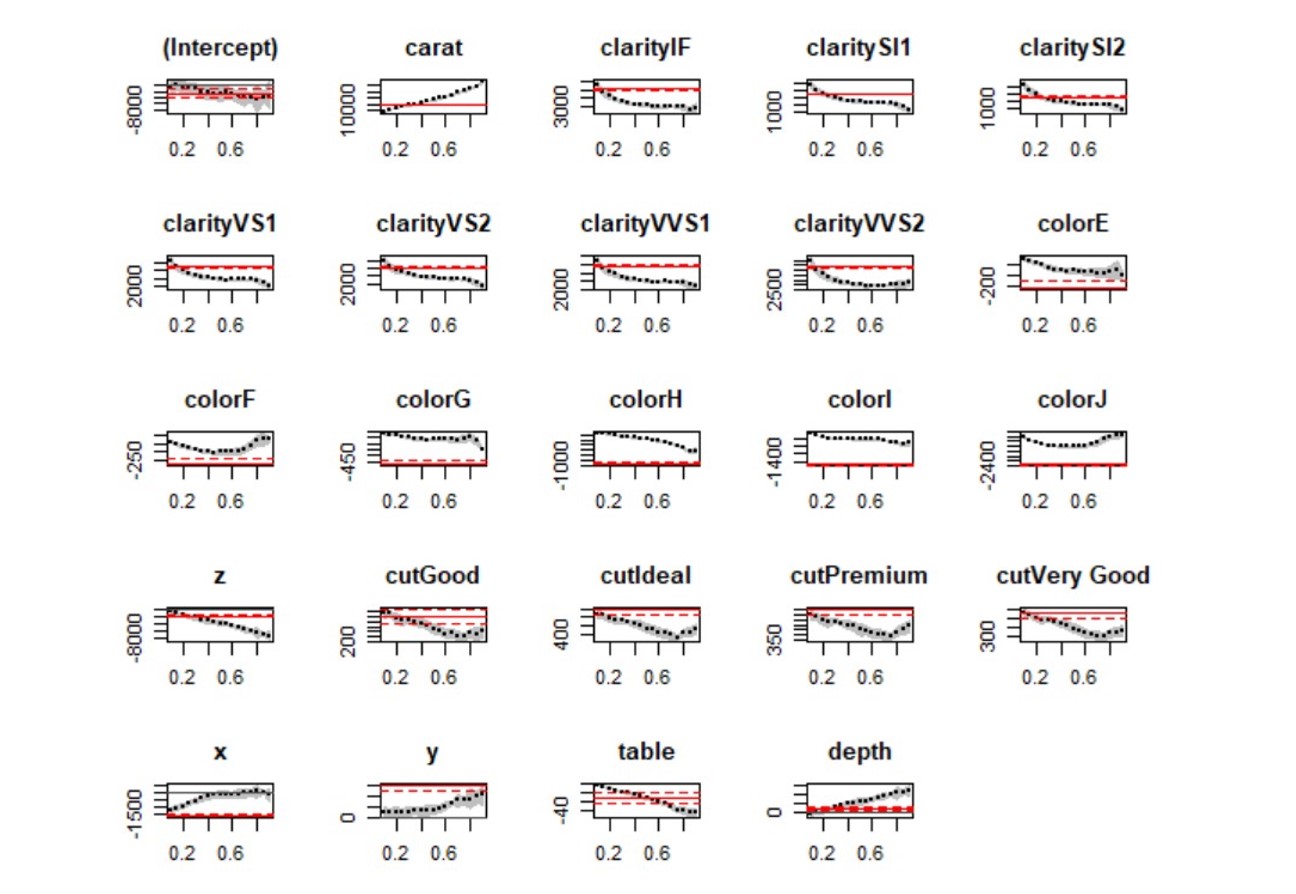
We used 0.1, 0.5, and 0.9 as thresholds for quantile regressions. The R-Squared of 10% quantile regression is 0.41, 50% quantile is 0.78, and 90% quantile is 0.19. All the explanatory variables had heterogeneous impacts across different quantiles. For example, ClarityIF and ClaritySI2 both had positive effects on price, but these coefficients decrease across quantiles, which means their impacts are diminishing. In addition, Carat had increasing positive coefficients across quantiles, and we can see that the impact of carat on high quantiles was twice as large as that on lower quantiles.
Stepwise Linear Regression
We ran stepwise linear regression on price in our training dataset. The resulting model included carat, clarity, color, z, cut, x, y, table, and depth as explanatory variables and results in an in-sample multiple R-Squared of 0.923. All of the explanatory variables are significant at the 0.05 level.
Regression Tree
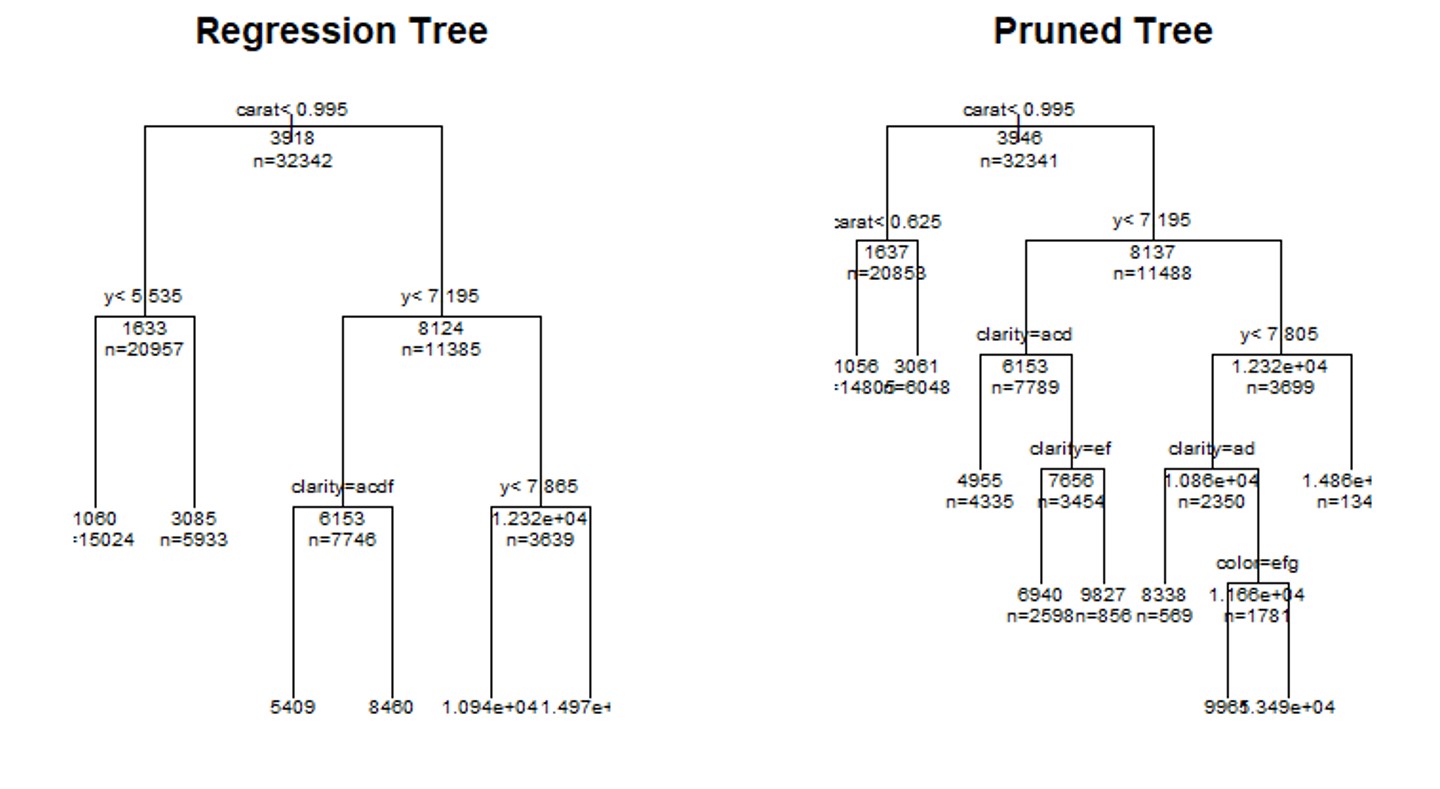
In order to predict price, we created a regression tree model. We built the original model and found that the ideal tree, with the lowest relative error and cp value, had six levels.
We then pruned the tree to the height specified. The regression tree found that carat was the most important variable in determining the eventual price of the diamond, followed by the three dimension variables (y,x, and z), and then clarity.
Evaluation
We tested the out-of-sample performance and used R-squared to compare each of the models. We found the linear model that used Lasso variable selection and the linear model that used stepwise variable selection both had the lowest value of OOS R-squared (0.916736). We decided to use the stepwise model, as the Lasso model requires data transformation, as the categorical variables must be in “dummy” form. Thus, the stepwise function requires less effort and is easily interpretable.
Deployment
The goal of our project is to predict diamond price more accurately over the long term to maximize our company profit. According to our Stepwise linear model, the variables that have a significant impact on price were carat, cut, color, clarity, depth, table and x, y ,z. We could calculate the price by entering each of the variable into a database, that automatically applies the stepwise formula, when new diamonds come in stock.
However, this dataset does not include the costs related to acquiring and selling the diamonds, the sales volume for each kind of diamond, or the customer demand. Since diamonds are a precious and scarce gemstone, price predicting of diamond is related to diamond source. Also, regions with different cultures and populations will have their own demands on diamonds, which will impact diamond prices differently. Our dataset does not include variables about diamond source and regions, so the predicted price may fail to capture the true market trend of diamond. Additional data is needed to better estimate the selling price and market trends to maximize profit in certain locations.
There is also serious ethical considerations when participating in the sale of diamonds. The diamond industry has long been haunted by social criticism that its business is fueling illegal and inhumane diamond mining in Africa. Although focusing on profit maximization for our own company, we want to make sure our diamonds are coming from a clean ethical source.